
Last semester in December I spoke to one of my professors about obtaining research with him. Dr. Mark Pierce has been working on a Lab for a while now where nanoparticle technology is being used to detect cancer cells within mice. Nanoparticle which give off an infrared signal are retrofitted with a receptor that is specific to the metastatic cancer cells that the mice have been growing (human breast cancer cells). The idea is to image the mice before injecting the nanoparticles and then image them again immediately after injection and 24 hours after the injection. The nanoparticles are injected intravenously in the tail of the mouse and then spread throughout the mouse from there.
In this lab there are 7 different groups of mice, all of which live in their own cages for the span of the lab which is roughly 5 weeks. The mice are cared for well and they are imaged once per week in order to monitor the progress of the cancer and other controls.
My job as the undergraduate researcher working with Dr. Mark Pierce is to take the images and process them. I have to analyze the images and extract the heatmap from the SWIR images and overlay them on top of the original incandescent image of the mouse using Matlab. I receive two kinds of images for each mouse, the incandescent image of the mouse where the mouse is visible within the picture and the SWIR image where the image is completely dark until the Matlab software creates a heatmap of the nanoparticles it picks up. With each picture set, I get a pre-inject, an immediately post-inject, and a 24 hours post-inject picture that I compare back to the pre-inject image of that mouse for that week.
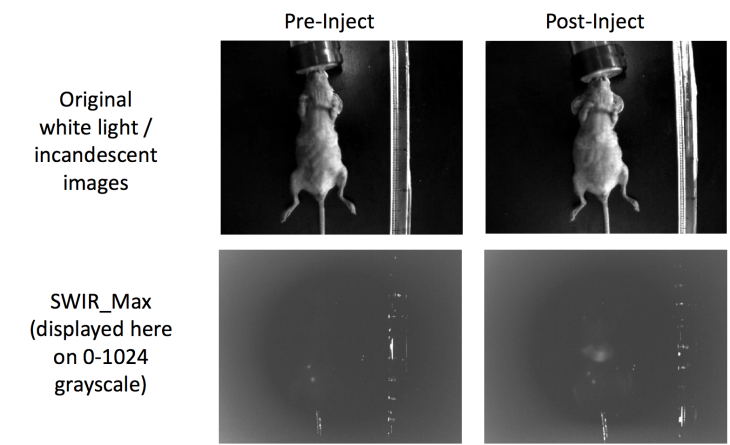
Once the above images of the mice are uploaded into the Matlab software, using the code that was developed for this experiment, we can develop a heatmat from the two SWIR_MAX photos above. This is accomplished by subtracting the amount of pixels that the nanoparticles excited in the post-injection image by the amount of pixels that were excited in the pre-injection photo. Since the pre-injection photo does not contain nearly as many excited pixels, due to the fact that there are no nanoparticles present, a nice heatmap can be generated outlining the areas of the nanoparticle detection. Once Matlab creates a heatmap from this process, I can then overlay the heatmap onto the post-injection incandescent image of the mouse in order to see where inside the mouse the nanoparticles are binding to cancer cells.
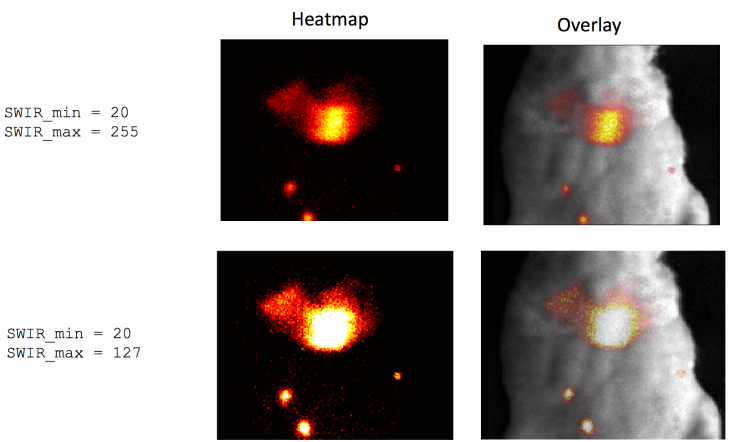
As seen above, it is clear that the values to the left indicated by the min and max values are the amount of pixel excitation and the heatmaps in the center are created by subtracting those two values and lighting up where those locations are. The Overlay is just the original incandescent image with the heatmap over it so it can be clearly seen that this mouse has a high concentration of nanoparticles somewhere near the liver or lungs.
I will continue to update the research that I am doing throughout this semester throughout multiple posts. Hope this was an enlightening and cool little experiment for you to read about. In reality this could save many lives with the practical applications this could have in Cancer cell detection on a cellular level. This could end up saving countless lives by catching cancer at the earliest stages possible, when it is just a few cells.
